
 2025/09/30
When it comes to capturing precise and reliable images in scientific research, the quality of your data depends on more than just resolution or sensor size. One of the most important—but sometimes overlooked—metrics is Signal-to-Noise Ratio (SNR). In imaging systems, SNR determines how clearly you can distinguish the actual signal (useful information) from unwanted noise.
In scientific imaging applications like microscopy, astronomy, and spectroscopy, a poor SNR can mean the difference between detecting a faint target and missing it entirely. This article explores how SNR is defined, why it matters, how it affects contrast, and how to select and optimize a scientific camera based on this critical metric.
What Is Signal-to-Noise Ratio and How Is It Defined?
The Signal to Noise Ratio (SNR) is the most important measure of our image quality, fundamental in image contrast, and often the most useful determining factor in whether a camera is sensitive enough for your application.
Attempts to improve camera sensitivity revolve around both improving the collected signal:
● Through improvements in quantum efficiency or an increase in pixel size
● Reducing camera-dependent sources of noise
Noise sources add up together, but depending on circumstances one can dominate, and should be focused on when attempting to improve SNR – either through optimizing settings or setup, or upgrading to better light sources, optics, and cameras.
It’s common shorthand to describe images in terms of a single signal-to-noise ratio, for example claiming an image has an SNR of '15'. However, as is evident from the name, the signal-to-noise ratio depends upon the signal, which will of course be different for each pixel. This is what gives us our image.
The SNR of an image typically refers to the SNR of the peak signal of interest within the image. For example, SNR from an image of fluorescent cells on a dark background would use the peak signal intensity from the pixels of a structure of interest within the cell.
It is not representative to take, for example, a mean value for the SNR of the whole image. In techniques such as fluorescence microscopy where a dark background with zero detected photons can be common, these zero signal pixels have an SNR of zero. Therefore, any average across an image would depend upon how many background pixels were in view.
Why SNR Matters for Scientific Cameras
In scientific imaging, SNR directly impacts how well you can identify faint details, measure quantitative data, and reproduce results.
● Image Clarity – Higher SNR reduces graininess and makes fine structures visible.
● Data Accuracy – Reduces measurement errors in intensity-based experiments.
● Low-Light Performance – Essential for fluorescence microscopy, deep-sky astrophotography, and spectroscopy, where photon counts are naturally low.
Whether you’re using a sCMOS camera for high-speed imaging or a cooled CCD for long-exposure applications, understanding SNR helps you balance performance trade-offs.
How SNR Influences Image Contrast
Contrast is the relative difference in intensity between light areas and dark areas of an image. For many applications, good image contrast within areas of interest is the ultimate end goal.
There are many factors within the imaging subject, optical system and imaging conditions that are the primary determining factors of image contrast, such as lens quality and amount of background light.
● High SNR → Distinct separation between bright and dark regions; edges appear crisp; subtle details remain visible.
● Low SNR → Dark areas get brighter due to noise, bright areas get dimmer, and overall image contrast flattens.
For example, in fluorescence microscopy, low SNR can make a weakly fluorescent sample blend into the background, making quantitative analysis unreliable. In astronomy, faint stars or galaxies can disappear entirely in noisy data.
However, there are also factors within the camera itself – the primary factor being the Signal to Noise Ratio. Further, and especially at low light, image intensity scaling, how the image is displayed on the monitor, plays a large role in the perceived image contrast. With high noise in dark areas of the image, auto image scaling algorithms can have their lower bound set too low by low-value noisy pixels, while the high bound is increased by noise in high signal pixels. This is the cause of the characteristic ‘washed-out’ gray appearance of low-SNR images. Better contrast can be obtained by setting the lower bound to the camera offset.
Factors That Affect SNR in Scientific Cameras
Several design and operational parameters influence the SNR of a camera system:
Sensor Technology
● sCMOS – Combines low read noise and high frame rates, ideal for dynamic imaging.
● CCD – Historically offers low noise in long exposures, but slower than modern CMOS designs.
● EMCCD – Uses on-chip amplification to boost weak signals, but can introduce multiplicative noise.
Pixel Size and Fill Factor
Larger pixels collect more photons, increasing the signal and thus the SNR.
Quantum Efficiency (QE)
Higher QE means more incoming photons are converted to electrons, improving SNR.
Exposure Time
Longer exposures gather more photons, increasing the signal, but may also increase dark current noise.
Cooling Systems
Cooling reduces dark current, significantly improving SNR for long exposures.
Optics and Illumination
High-quality lenses and stable illumination maximize signal capture and minimize variability.
Examples of Different Peak SNR Values
In imaging, PSNR often refers to a theoretical maximum relative to pixel saturation. Despite differences in imaging subjects, imaging conditions and camera technology, for conventional scientific cameras, images with the same signal-to-noise ratio can have similarities. The degree of 'graininess', variation from frame to frame, and to some extent the contrast, can all be similar across these different conditions. Therefore, it is possible to gain an understanding of SNR values and the different conditions and challenges they imply from representative images, such as those shown in the table.
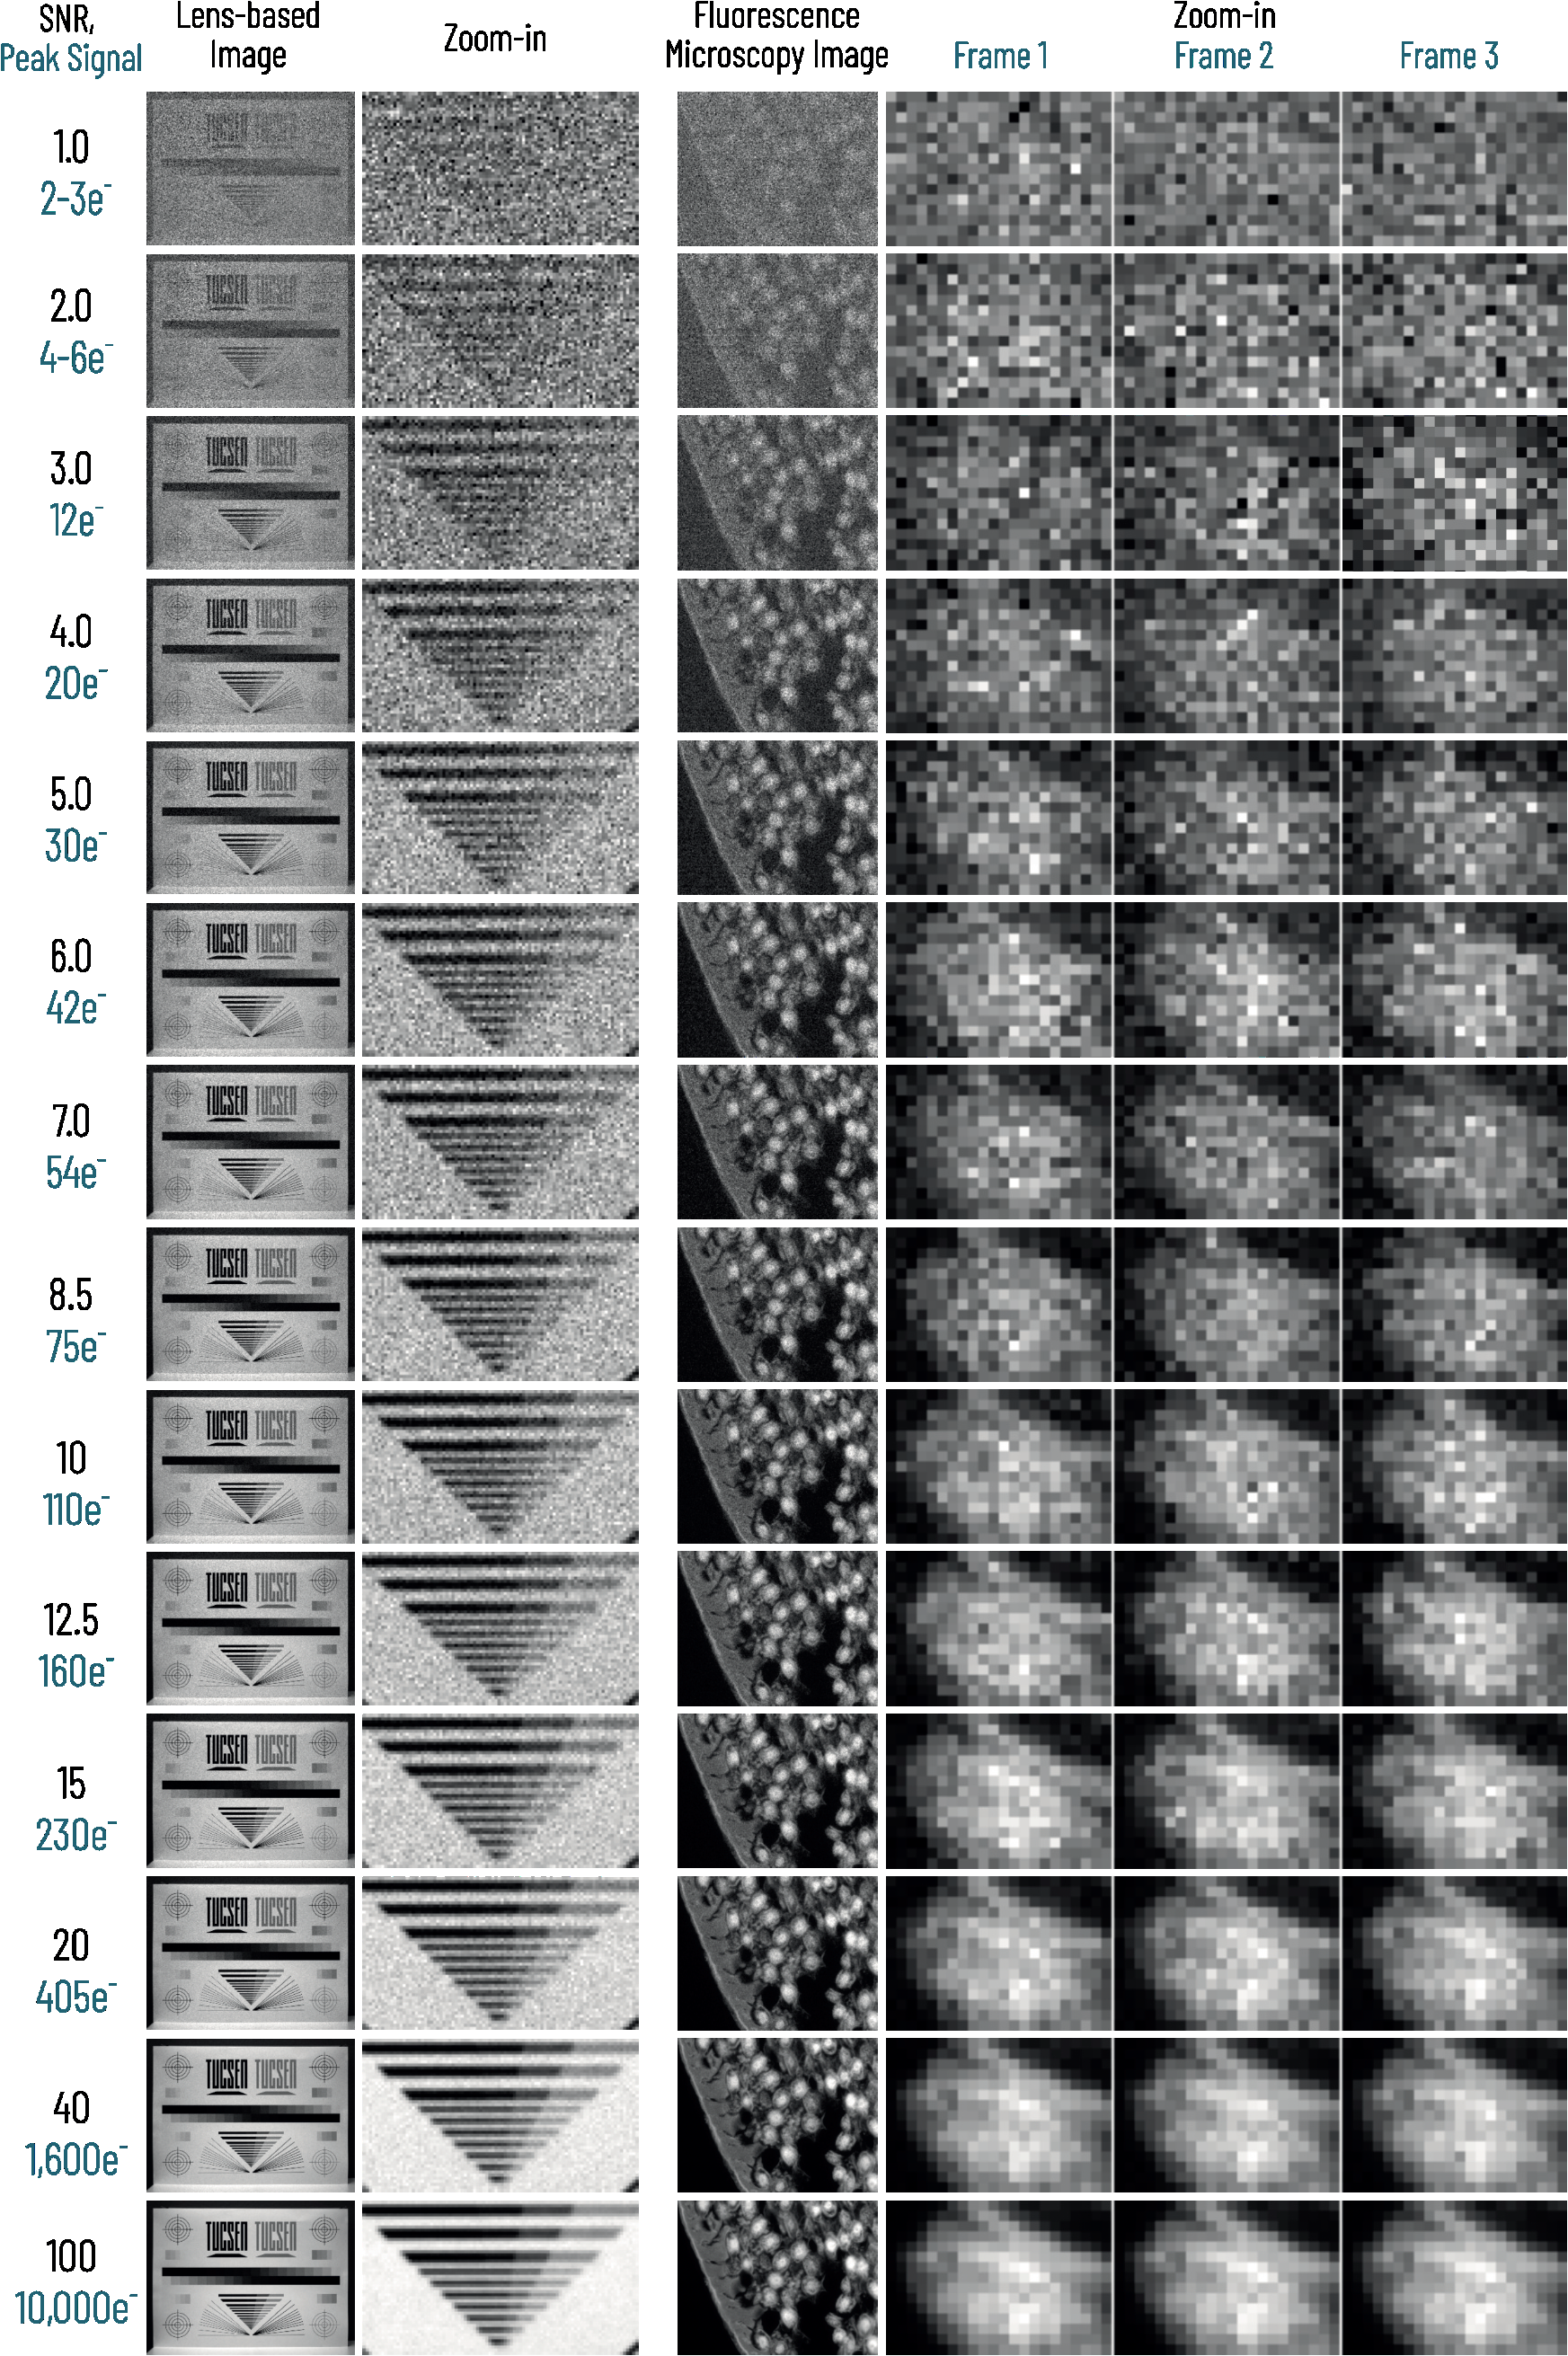
NOTE: Peak signal values in photoelectrons for each row is given in blue. All images displayed with auto histogram scaling, ignoring (saturating)0.35% of the brightest and darkest pixels. Left two image columns: Lens-based imaging of an imaging test target. Right four columns: Ascaris captured in fluorescence with a 10x microscope objective. To illustrate the frame-to-frame variations in pixel values at lower SNR, three successive frames are provided.
A lens-based image of a test target, along with a fluorescence microscopy image are both shown, along with a zoomed view of the fluorescent image showing the variation within 3 successive frames. The peak photo-electron count at each signal level is also given.
The following figure shows the full versions of these example images for reference.
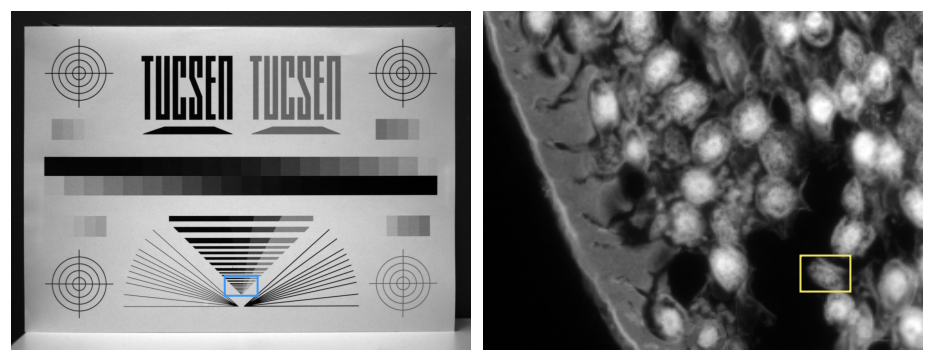
Left: An imaging test target photographed with a lens.
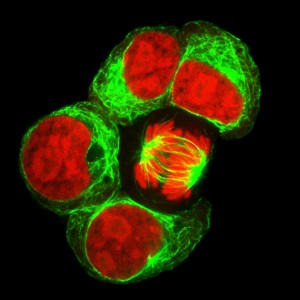
Right: A sample of Ascaris nematode worm section viewed with fluorescence microscopy at 10x magnification.
|
|
|
|
 |
|
 |
SNR in Applications
SNR is mission-critical across various fields:
● Microscopy – Detecting faint fluorescence in biological samples requires high SNR to avoid false negatives.
● Astronomy – Identifying distant galaxies or exoplanets demands long exposures with minimal noise.
● Spectroscopy – High SNR ensures accurate peak intensity measurements in chemical analysis.
● Industrial Inspection – In low-light assembly lines, high SNR helps detect defects reliably.
Choosing a Scientific Camera with the Right SNR
When evaluating a new scientific camera:
● Check SNR Specifications – Compare dB values under conditions similar to your application.
● Balance Other Metrics – Consider quantum efficiency, dynamic range, and frame rate.
● Match Technology to Use Case – For high-speed dynamic scenes, a sCMOS camera may be ideal; for ultra-low-light static subjects, a cooled CCD or EMCCD may perform better.
● Connectivity for Workflow Efficiency – While not affecting SNR directly, features such as HDMI output can enable real-time image review, helping you quickly verify that your acquisition settings achieve the desired SNR.
Conclusion
Signal-to-Noise Ratio (SNR) is a key performance metric that directly influences the clarity and reliability of scientific images. Understanding how SNR is defined, the factors that affect it, and the implications of different SNR values allows researchers and technical users to evaluate imaging systems more effectively. By applying this knowledge—whether in selecting a new scientific camera or optimizing an existing setup—you can ensure that your imaging workflow captures data with the level of precision required for your specific application.
FAQs
What is considered a "good" SNR for scientific cameras?
The ideal SNR depends on the application. For highly demanding, quantitative work—such as fluorescence microscopy or astronomy—an SNR above 40 dB is generally recommended, as it produces images with minimal visible noise and preserves fine details. For general laboratory use or industrial inspection, 35–40 dB can be sufficient. Anything below 30 dB will typically show visible grain and can compromise accuracy, especially in low-contrast situations.
How does quantum efficiency (QE) affect SNR?
Quantum efficiency measures how effectively a sensor converts incoming photons into electrons. A higher QE means more of the available light is captured as signal, boosting the numerator in the SNR equation. This is especially important in low-light scenarios, where every photon counts. For example, a sCMOS camera with a QE of 80% will achieve higher SNR under identical conditions compared to a sensor with 50% QE, simply because it captures more usable signal.
What’s the difference between SNR and Contrast-to-Noise Ratio (CNR)?
While SNR measures the overall signal strength relative to noise, CNR focuses on the visibility of a specific feature against its background. In scientific imaging, both are important: SNR tells you how “clean” the image is overall, while CNR determines whether a particular object of interest stands out enough for detection or measurement.
Want to learn more? Take a look at related articles:
Quantum Efficiency in Scientific Cameras: A Beginner’s Guide
Tucsen Photonics Co., Ltd. All rights reserved. When citing, please acknowledge the source: www.tucsen.com


