
 2025/12/03
In a TDI (Time Delay Integration) imaging system, image blur and geometric distortion are among the most common issues users encounter. When these artifacts appear, many users instinctively assume the camera is malfunctioning. In practice, however, the true determinant of TDI imaging stability is the synchronization between the stage motion, trigger timing, and the camera line rate.
This article explains the theoretical relationship between line rate and stage velocity, provides a systematic workflow for debugging synchronization issues, and uses a real engineering case to demonstrate how to achieve high-precision, stable TDI imaging.
Theoretical Relationship Between TDI Camera Line Rate and Stage Speed
A TDI line-scan camera achieves high SNR by integrating charge across multiple sensor lines. During object motion, the rate of charge transfer must remain strictly synchronized with the object’s displacement in the field of view; otherwise, the accumulated signal no longer represents a coherent integration.
In an ideal setup, each line-to-line charge transfer corresponds exactly to one pixel of object movement. Therefore, the theoretical relationship between line rate and platform speed is:
F=V/P′
Line rate = Stage speed ÷ Pixel pitch
F = line rate (Hz)
V = stage velocity (mm/s)
P′ = effective pixel pitch in object space (mm)
The effective pixel pitch in object space (P′) is determined by optical magnification:
P′=P/M
Effective pixel pitch in object space = Camera pixel size ÷ Optical magnification
P = camera pixel size (mm)
M = optical magnification
Combining the two equations yields:
F=V*M/P
Line rate = Stage velocity × Magnification ÷ Pixel size
Example:
For a pixel size of 5 μm, magnification of 2×, and stage velocity of 100 mm/s:
100x2÷0.005=40,000 Hz
Thus, the line rate must be 40 kHz to maintain proper synchronization.
When the line rate does not match stage speed, the TDI integration sequence becomes misaligned, directly causing geometric distortion. This mismatch is the most fundamental and frequent cause of image deformation in high-speed line-scan systems.
Typical Image Artifacts and Root Causes
Ideally, a stage should move in a stable, constant-velocity trajectory. In real applications, however, velocity fluctuations, vibration, and directional deviations all disrupt synchronization between TDI line rate and object motion. These desynchronization effects produce several characteristic image artifacts:
i) Image Compression or Stretching (Speed Mismatch)
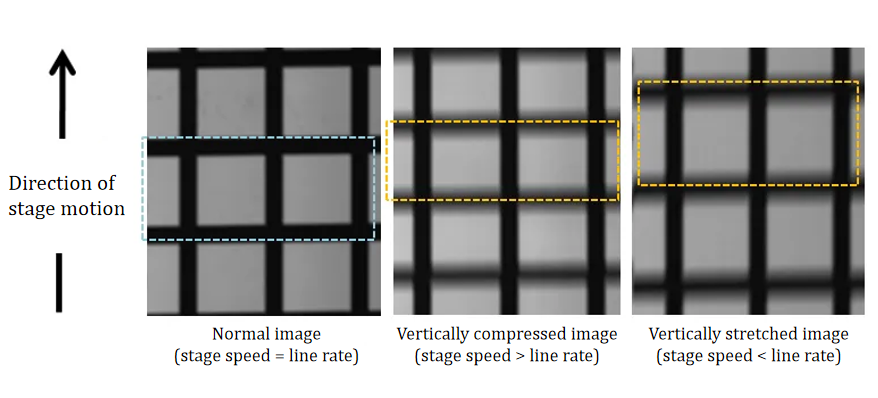
Figure 1. Image compression or stretching caused by mismatch between stage velocity and TDI line rate.
● Stage speed > Line rate
The object moves farther than one pixel per integration step, accumulating excessive signal.
Result: image compression or “squeezing” along the scan direction (Fig. 1-center).
● Stage speed < Line rate
The sensor integrates faster than the object motion, causing under-accumulation.
Result: stretched features or visible trailing artifacts (Fig. 1-right).
ii) Image Blur (Motion Not Aligned with Scan Direction)
TDI integration occurs strictly along the sensor’s charge-transfer direction. If the object exhibits orthogonal jitter, lateral motion, or rotation, the charge integration no longer overlays correctly.
Result: global image blur due to misaligned integration (Fig. 2).
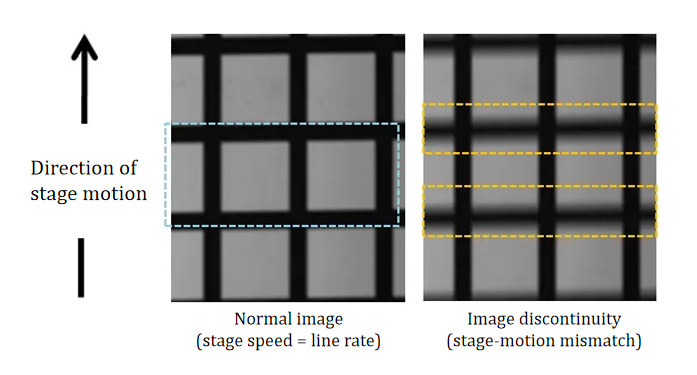
Figure 2. Image blur resulting from motion components not aligned with the TDI integration direction.
iii) Image Breaks, Bending, or Pixel-Level Banding (Frequency Instability)
These artifacts occur when the stage motion and line rate lose micro-synchronization. Beyond typical acceleration/deceleration and mechanical vibration, fluctuations in the trigger frequency can also introduce line-to-line misalignment.
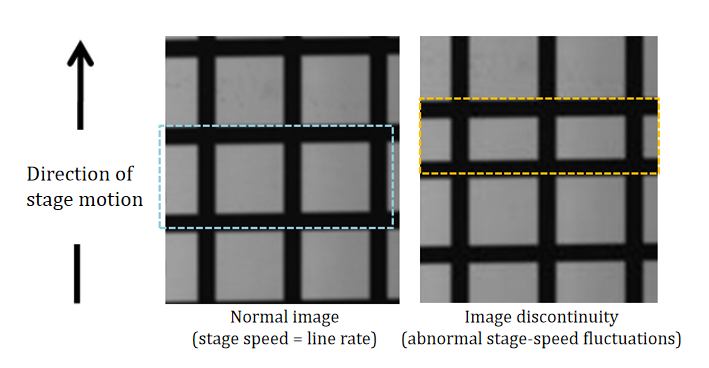
Figure 3. Image discontinuities caused by unstable motion frequency or trigger-rate fluctuations.
Symptoms include:
● discontinuities between adjacent lines
● curved features
● periodic pixel-level banding (Fig. 3)
This class of artifact is often subtle, representing one of the most challenging issues in TDI imaging.
Representative Cases and Their Solutions
During commissioning of a high-end defect-inspection system, the customer reported persistently high false-detection rates. Initial suspicion focused on sensor noise obscuring weak defect signals, as shown in Fig. 4.
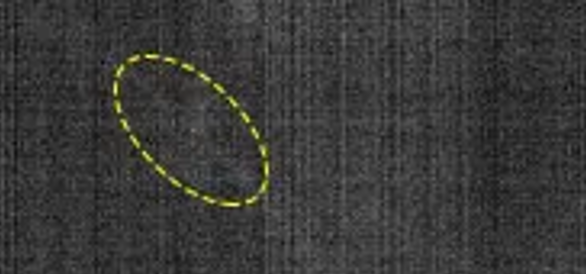
Figure 4. Before optimization — defect signals obscured by background noise due to synchronization instability.
After receiving the report, the Tucsen engineering team conducted an on-site diagnostic review. By systematically verifying stage motion, trigger timing, and line-rate synchronization, we identified the root cause:
The stage trigger signal lacked proper shielding. Electromagnetic interference introduced jitter into the trigger frequency, creating background instability in the TDI image and masking true defect information.
Based on the findings, two corrective measures were implemented:
a) The customer added shielding to the trigger signal cable, minimizing crosstalk and improving frequency stability.
b) Tucsen engineers optimized the camera’s internal processing, suppressing background fluctuations caused by residual line-rate jitter and further enhancing overall image quality.

Figure 5. After optimization — defect signals clearly resolved following improved synchronization and noise control.
With these corrective actions, the imaging performance improved significantly. Defect detection accuracy increased, and the customer recognized the project team for the substantial enhancement in system reliability.
Final Thoughts
In real-world machine-vision systems, TDI cameras must operate under varying illumination, diverse sample reflectance conditions, and mechanical vibration—making root-cause analysis far more complex than theoretical modeling suggests.
If your TDI system is facing synchronization, stability, or image-consistency challenges, the Tucsen technical team can provide full-scope support—from issue diagnosis and synchronization-model optimization to final imaging performance validation—to ensure your scientific camera–based TDI imaging system runs more stable, more accurate, and more efficient.
For additional background on how noise sources impact quantitative imaging, refer to our detailed discussion on signal-to-noise ratio in scientific cameras.
Tucsen Photonics Co., Ltd. All rights reserved. When citing, please acknowledge the source: www.tucsen.com


